Taxpayer
What New Jersey’s billion-dollar plan means for your district.
ONLY WHEN WE GAIN CONTROL OF OUR DOLLARS WILL GAIN CONTROL OF OUR CHOICE.
We are all taxpayers. It is important we understand how our tax dollars work within our system of public education. We fund the system. What happens when the system is not able to serve every student?
In fiscal year 2023, State Aid (income tax dollars) stood at a whopping $9,269,123,631. But these are only our income tax dollars.
Locally, property tax dollars in wealthier suburbs account for over 80% of district budgets. It should come as no surprise that wealthy suburbs and private schools are solely responsible for New Jersey’s #3 national ranking. Due in large part to a family’s ability and willingness to fill in gaps left by “A+” district schools.
Many families have left their public schools due to bullying and/or severe loss of learning. Many families are hiring outside tutors. Many families are able to exercise their choice with their dollars.
The glaring problem with this is that when a family leaves the public system for any variety of reasons, their income and property tax dollars remain hostage to a system that failed their student(s). And what happens to the majority of families who can’t afford to leave this money behind? These students don’t have a way out. What’s worse is that the system isn’t accountable to these students. We know this because we measure student proficiency.
WHY DO WE TREAT EDUCATION DIFFERENTLY WHEN IT COMES TO CHOICE?
You may know that our school funding formula varies vastly from one district to the next.
Do you know how this policy is working in your own district?
Do you know how much per pupil revenue your school district receives for your student(s)?
Let’s take a look at two of our public-school districts – Camden City & Holmdel.
Camden City District Per Pupil Revenue.
https://www.usnews.com/education/k12/new-jersey/districts/camden-city-school-district
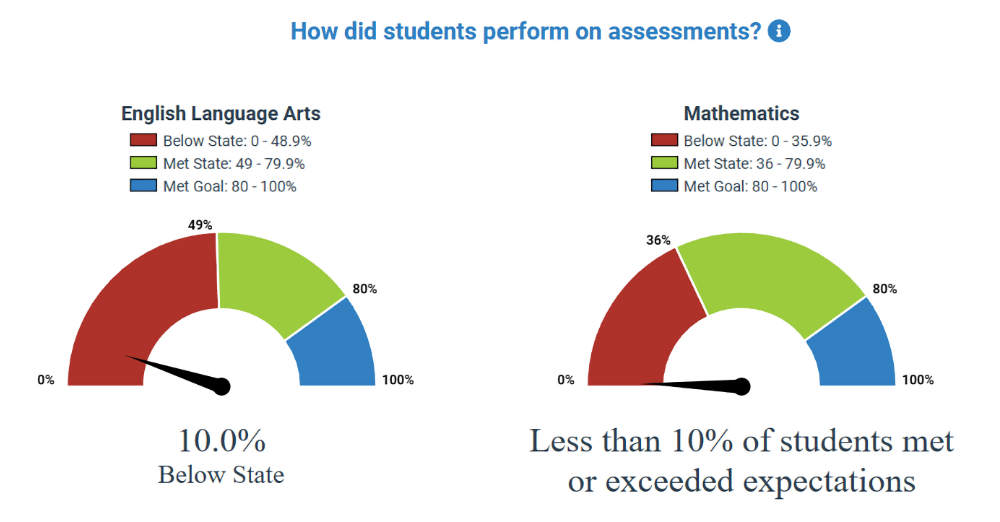
A student attending Camden City schools receives an average of $53,957 each year.
87% of this amount comes from the State.
Test proficiency scores are below 10%, on average.
This section shows the percentage of students who met or exceeded expectations on statewide assessments (NJSLA and DLM). This percentage reflects the federal proficiency rate which makes adjustments to the proficiency rate if the participation rate was below 95% to ensure reporting on at least 95% of students. The chart indicates whether performance was above the state average or above the state’s long-term goal of 80%.
Holmdel District Per Pupil Revenue.
https://www.usnews.com/education/k12/new-jersey/districts/holmdel-township-school-district
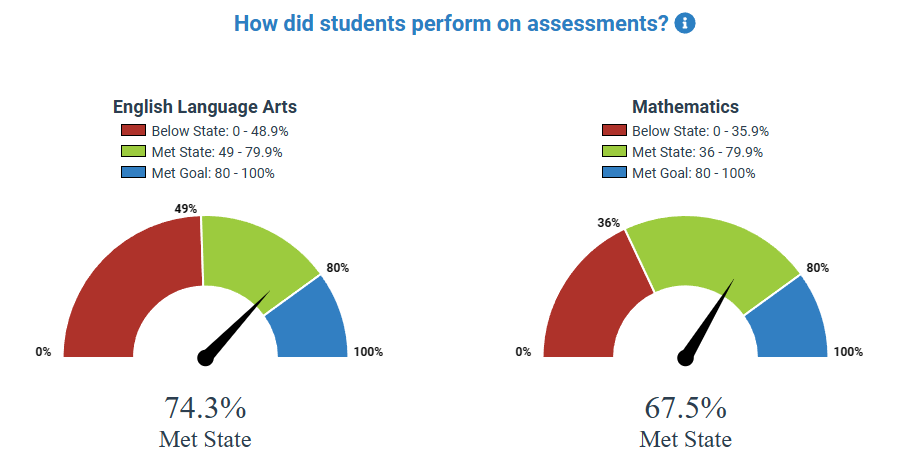
A student attending Holmdel schools receives an average of $24,833 each year.
17% of this amount comes from the State.
Test proficiency scores are around 70%, on average.
This section shows the percentage of students who met or exceeded expectations on statewide assessments (NJSLA A and DLM) This percentage reflects the federal proficiency rate which makes adjustments to the proficiency rate if the participation rate was below 95% to ensure reporting on at least 95% of students. The chart indicates whether performance was above the state average or above the state’s long-term goal of 80%.
We can clearly see that as the state’s aid increases, student proficiency declines.
Together we can empower educational entrepreneurs and educators to launch, and sustain, independent school and learning environments in their communities.
Together we can encourage policy that will enable families to be able to direct a portion of per-pupil funding into the school or learning environment that can best meet the needs of their student.
Together we can work to create, and expand, educational opportunities and real access to every family in The Garden State.


